Navigating the Portal
The PsychENCODE Knowledge Portal is designed to highlight and provide access to different types of data and related information. Let’s go through the different portal components so you can explore the site to suit your needs. Some of the sections below have labelled screenshots to help explain.
Homepage
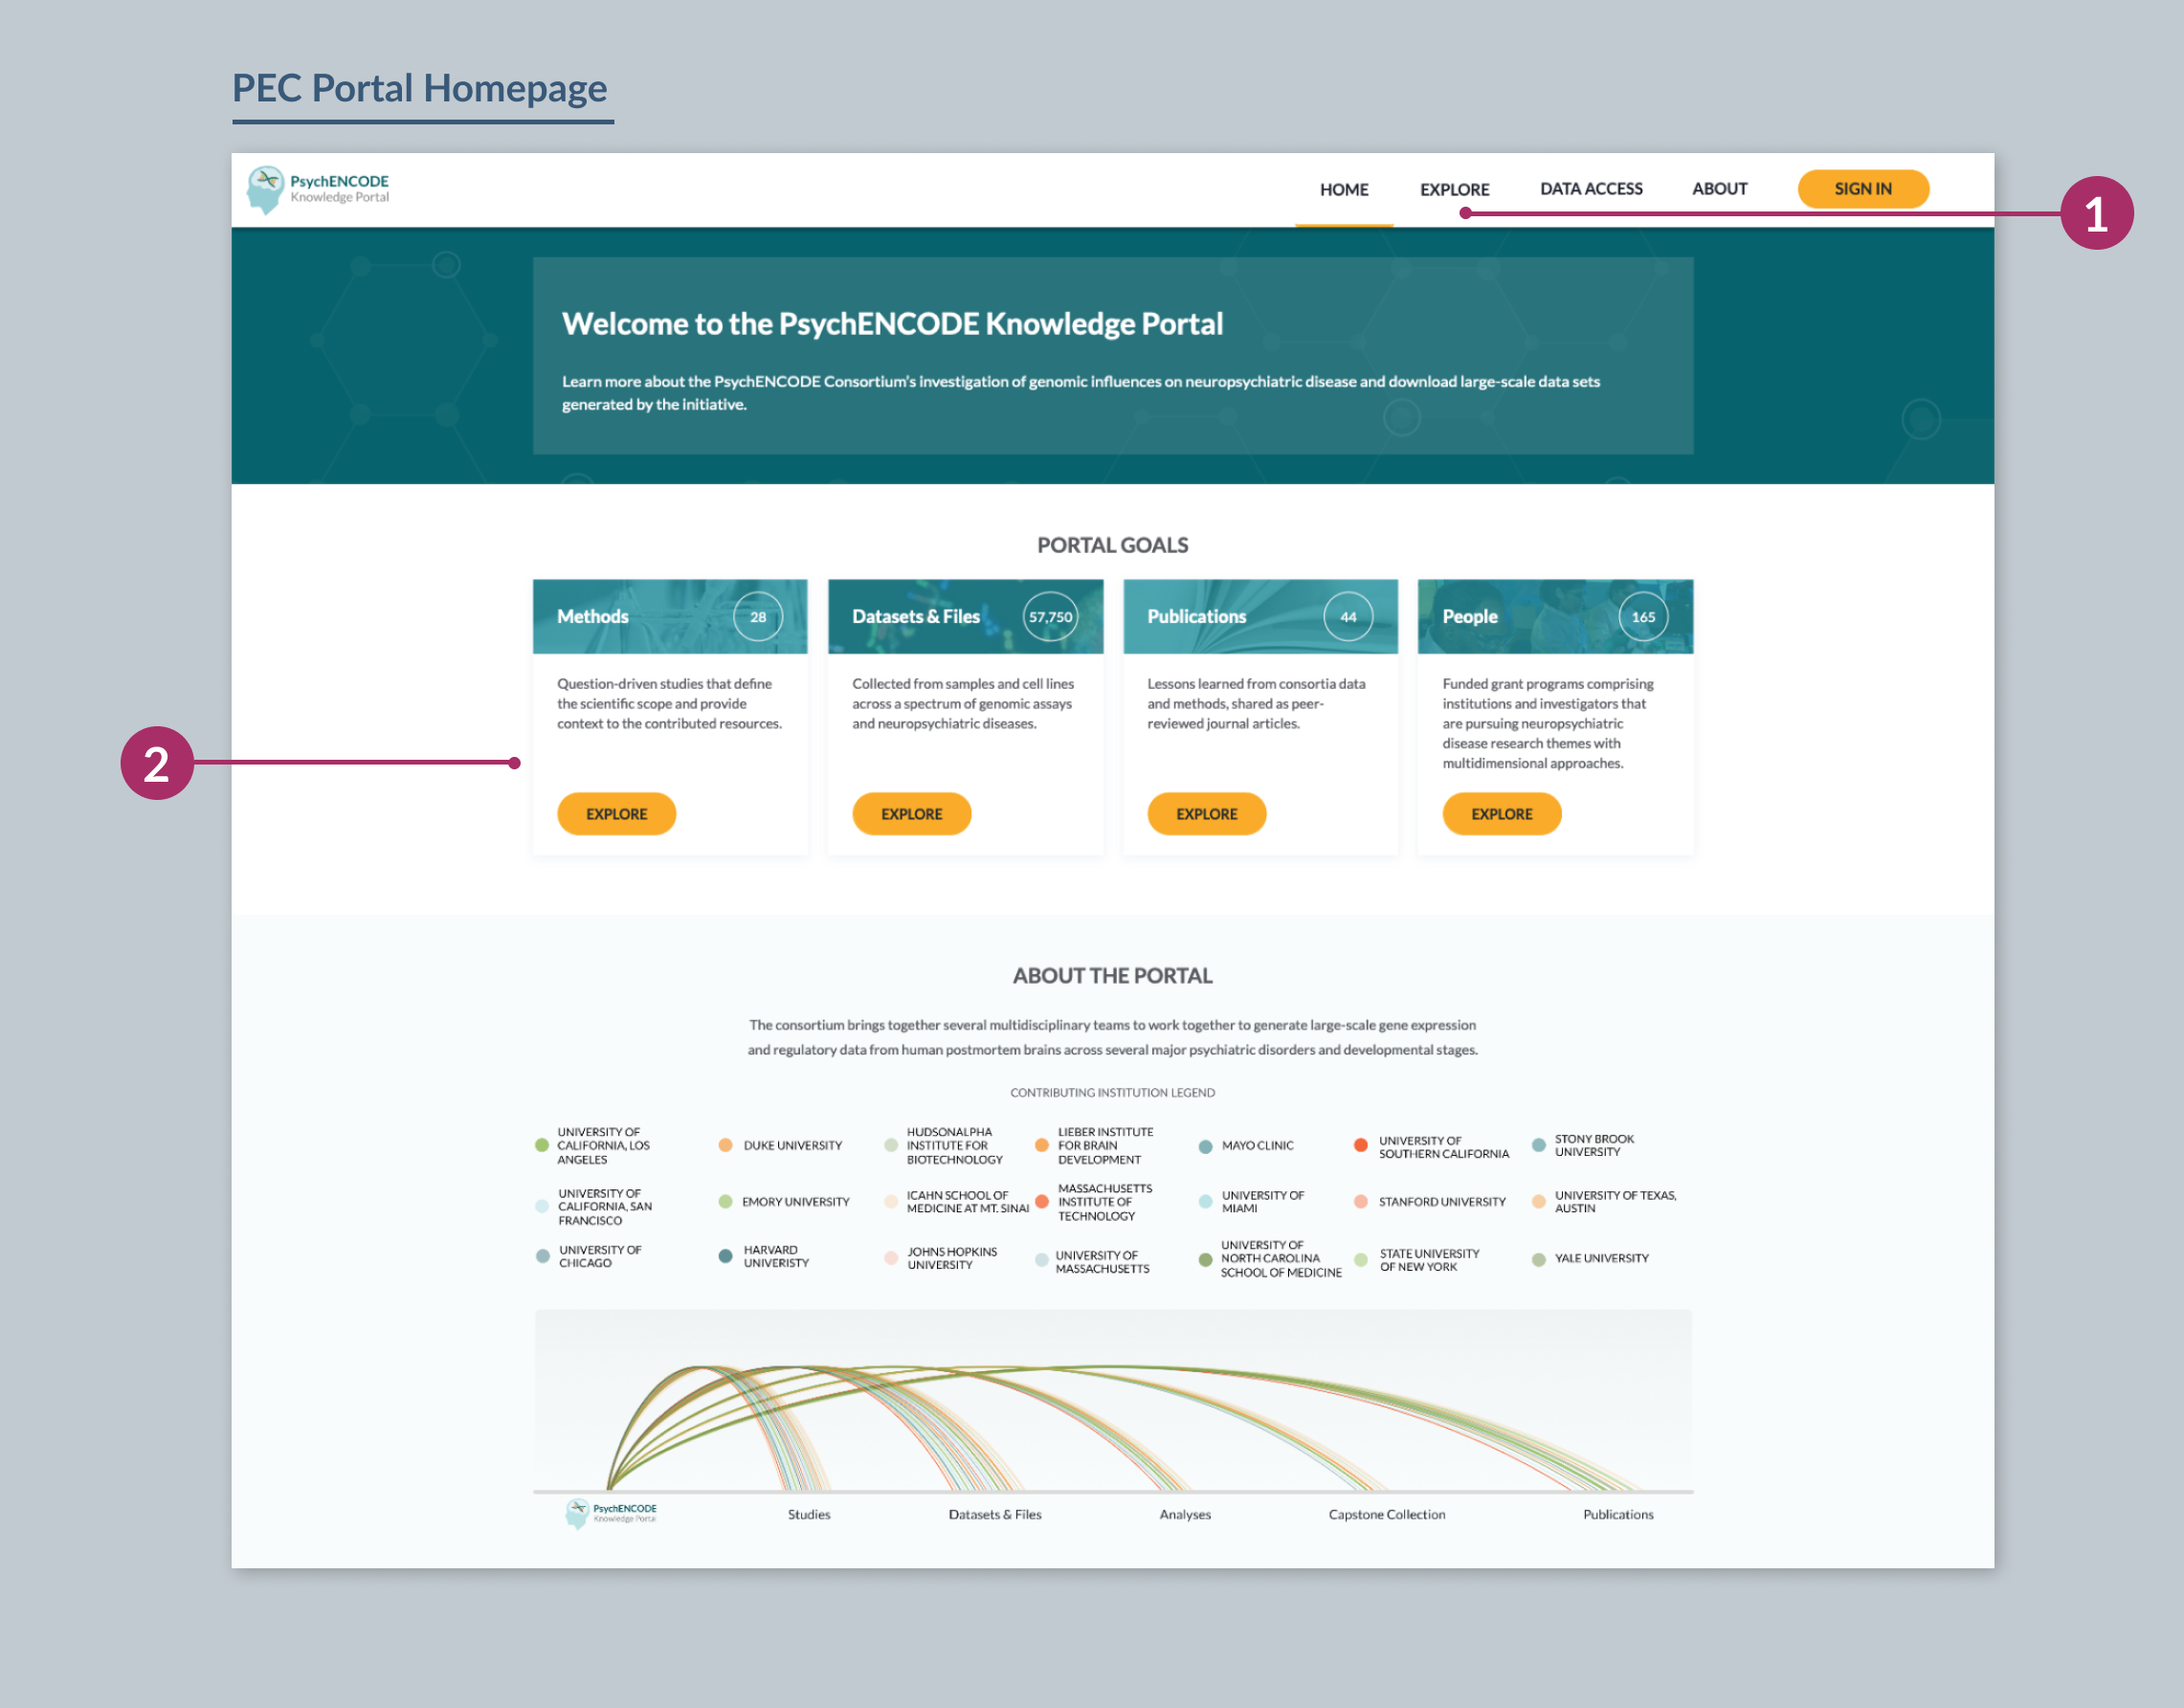
The homepage highlights various portal details that you can browse before diving into data exploration. Below is a breakdown of the different sections within the homepage:
Portal Goals
The four featured cards displayed in this section simply provide easy access to data, based on the category in which that data is organized. You can click Explore on any of these cards (2) to view the data organized by that category (alternatively, you can click Explore in the main navigation toolbar (1) and select the category there.
However you arrive at an Explore page, you can narrow down the data you need using filters. See Accessing Data to learn how to do this.
About the Portal
The visualization in this section represents the various multidisciplinary teams and institutions that contribute to data in the portal.
Featured Data
The visualization in this section represents the number of individuals who have multi-omic data characterized by a single assay or more than one assay type. Notice the graph is interactive—you can hover over any column or row in the graph to focus in.
Click Explore All Data to go to the Explore page, organized by Data.
Our People and Institutions
This section displays three featured cards, each highlighting a member of our consortium.
Click Explore All People to view and browse through all of the people involved in our consortium.
Related Resources
This section features our current resources related to the portal—PsychSCREEN and Capstone Collection. Click on either resource to learn more.
What’s New
This section displays portal-related news and data releases. Click Continue Reading to access any of the featured news, or click on View All News to visit the portal’s News section.
Explore
The Explore section is where you can access the portal data. Data is organized into categories, represented by the subtabs under the Explore tab in the navigation menu. You can explore data by Grants, Studies, Data, Publications, and People. More details on each of these categories is provided below.
Grants
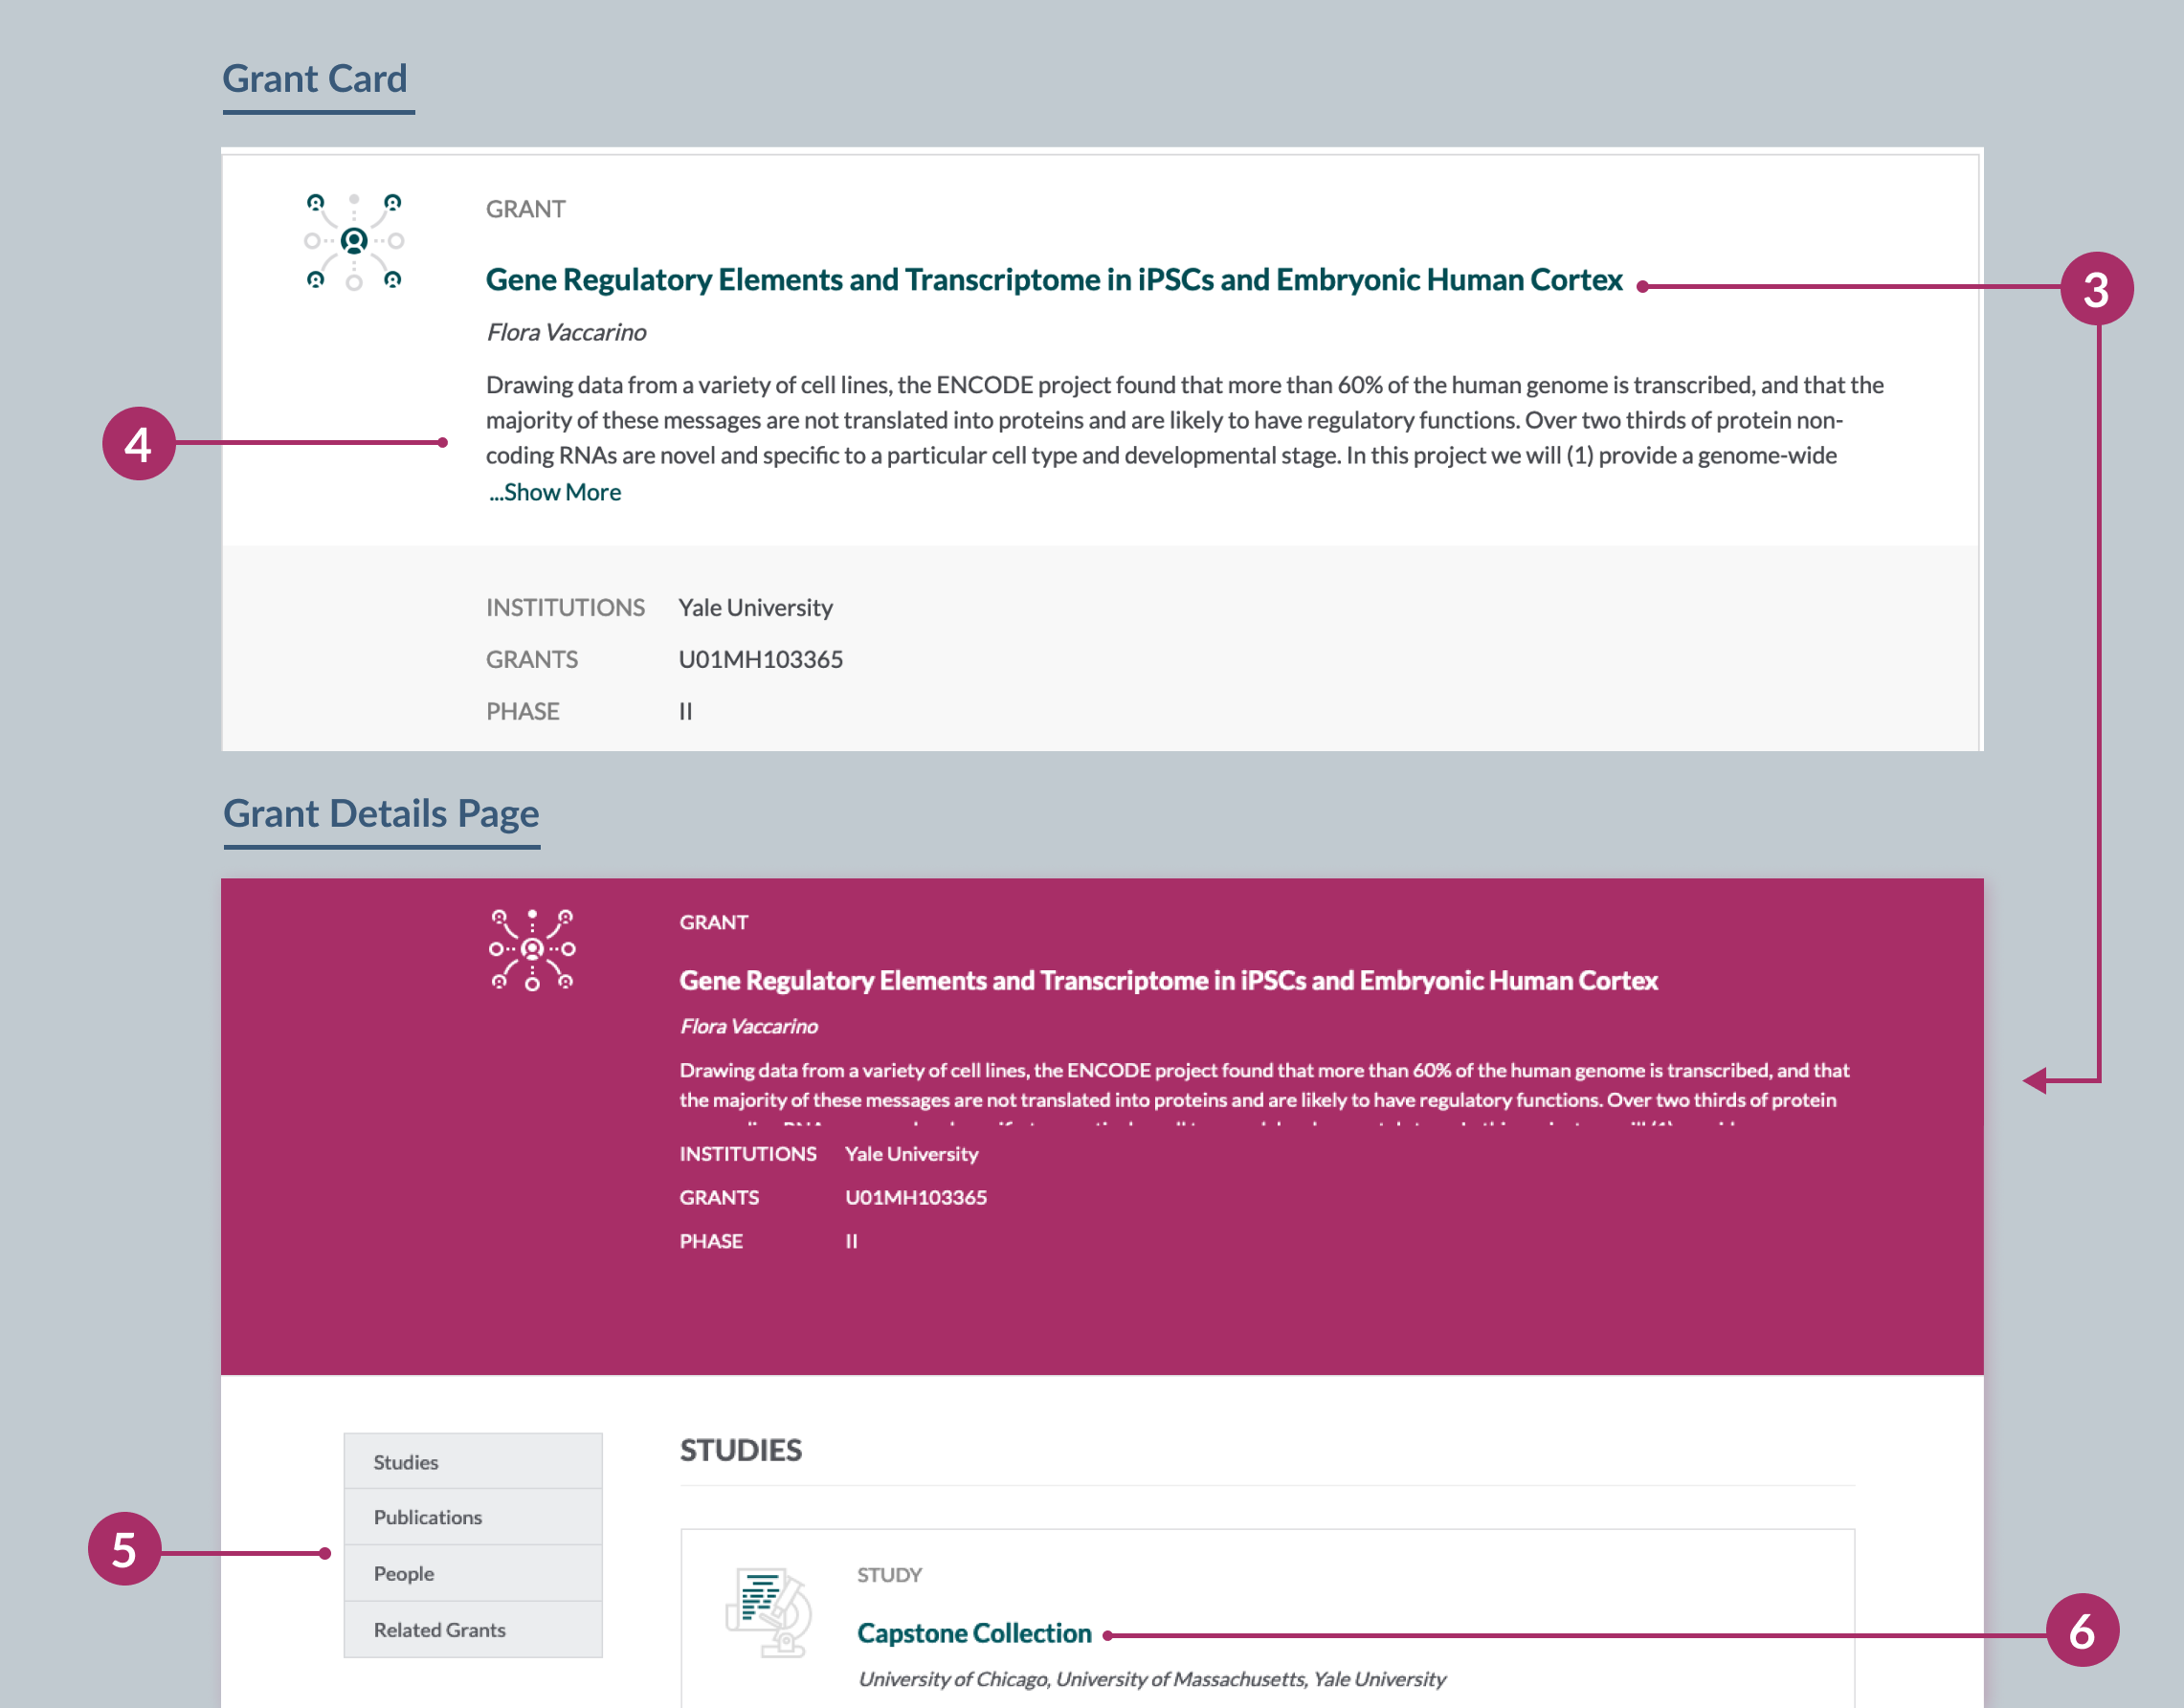
Explore the funding sources for the portal resources in the Grants section. Grant cards (4) highlight principal and key investigators, research institutions, and the research phase for each grant. Research Phase I of the PsychENCODE consortium culminated with the Science special issue "Revealing the brain's molecular architecture" in 2018, and research Phase II is currently underway. Search relevant grants by either the investigator name or the research phase. Click on a title of a grant (3) to visit the corresponding Grant Details page.
From here, scroll or use the navigation on the left of the page (5) to see the Studies, Publications, People and other Grants related to this Grant. Clicking the title of a study (6) will take you to the Study Details page.
Studies
Studies represent individual research projects with specific aims. For example, a study aim might focus on generating data to characterize a particular disease or genomic modality (e.g. chromatin conformation).
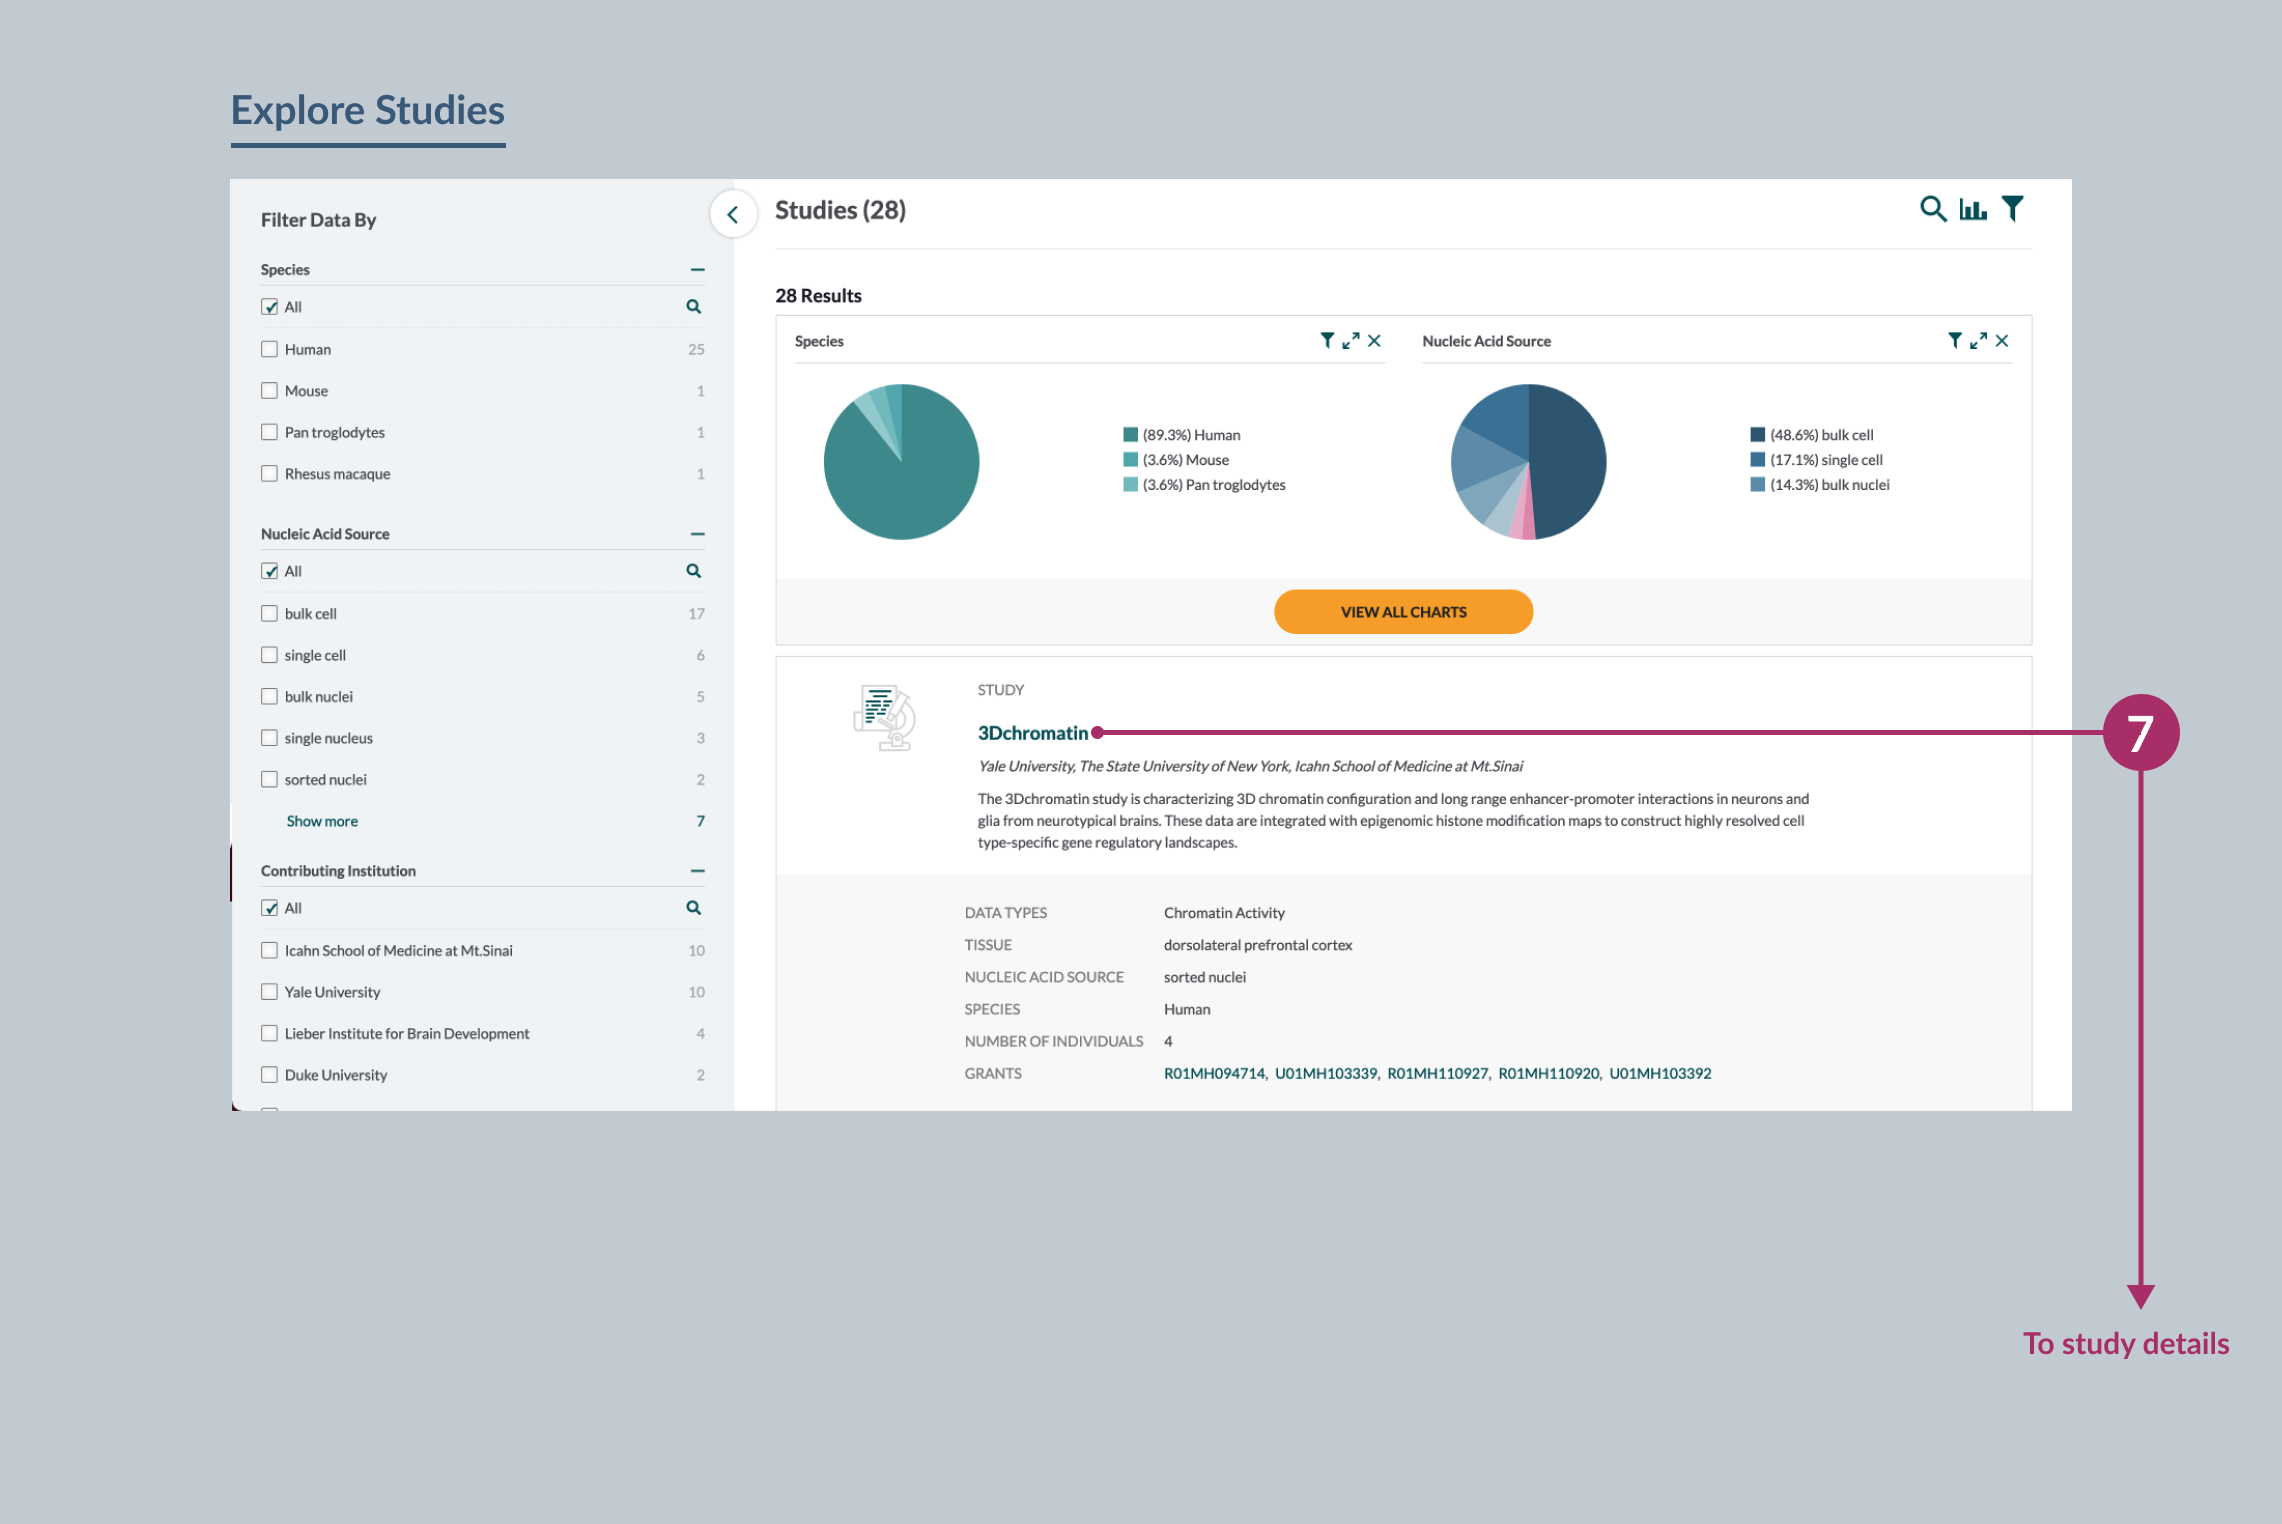
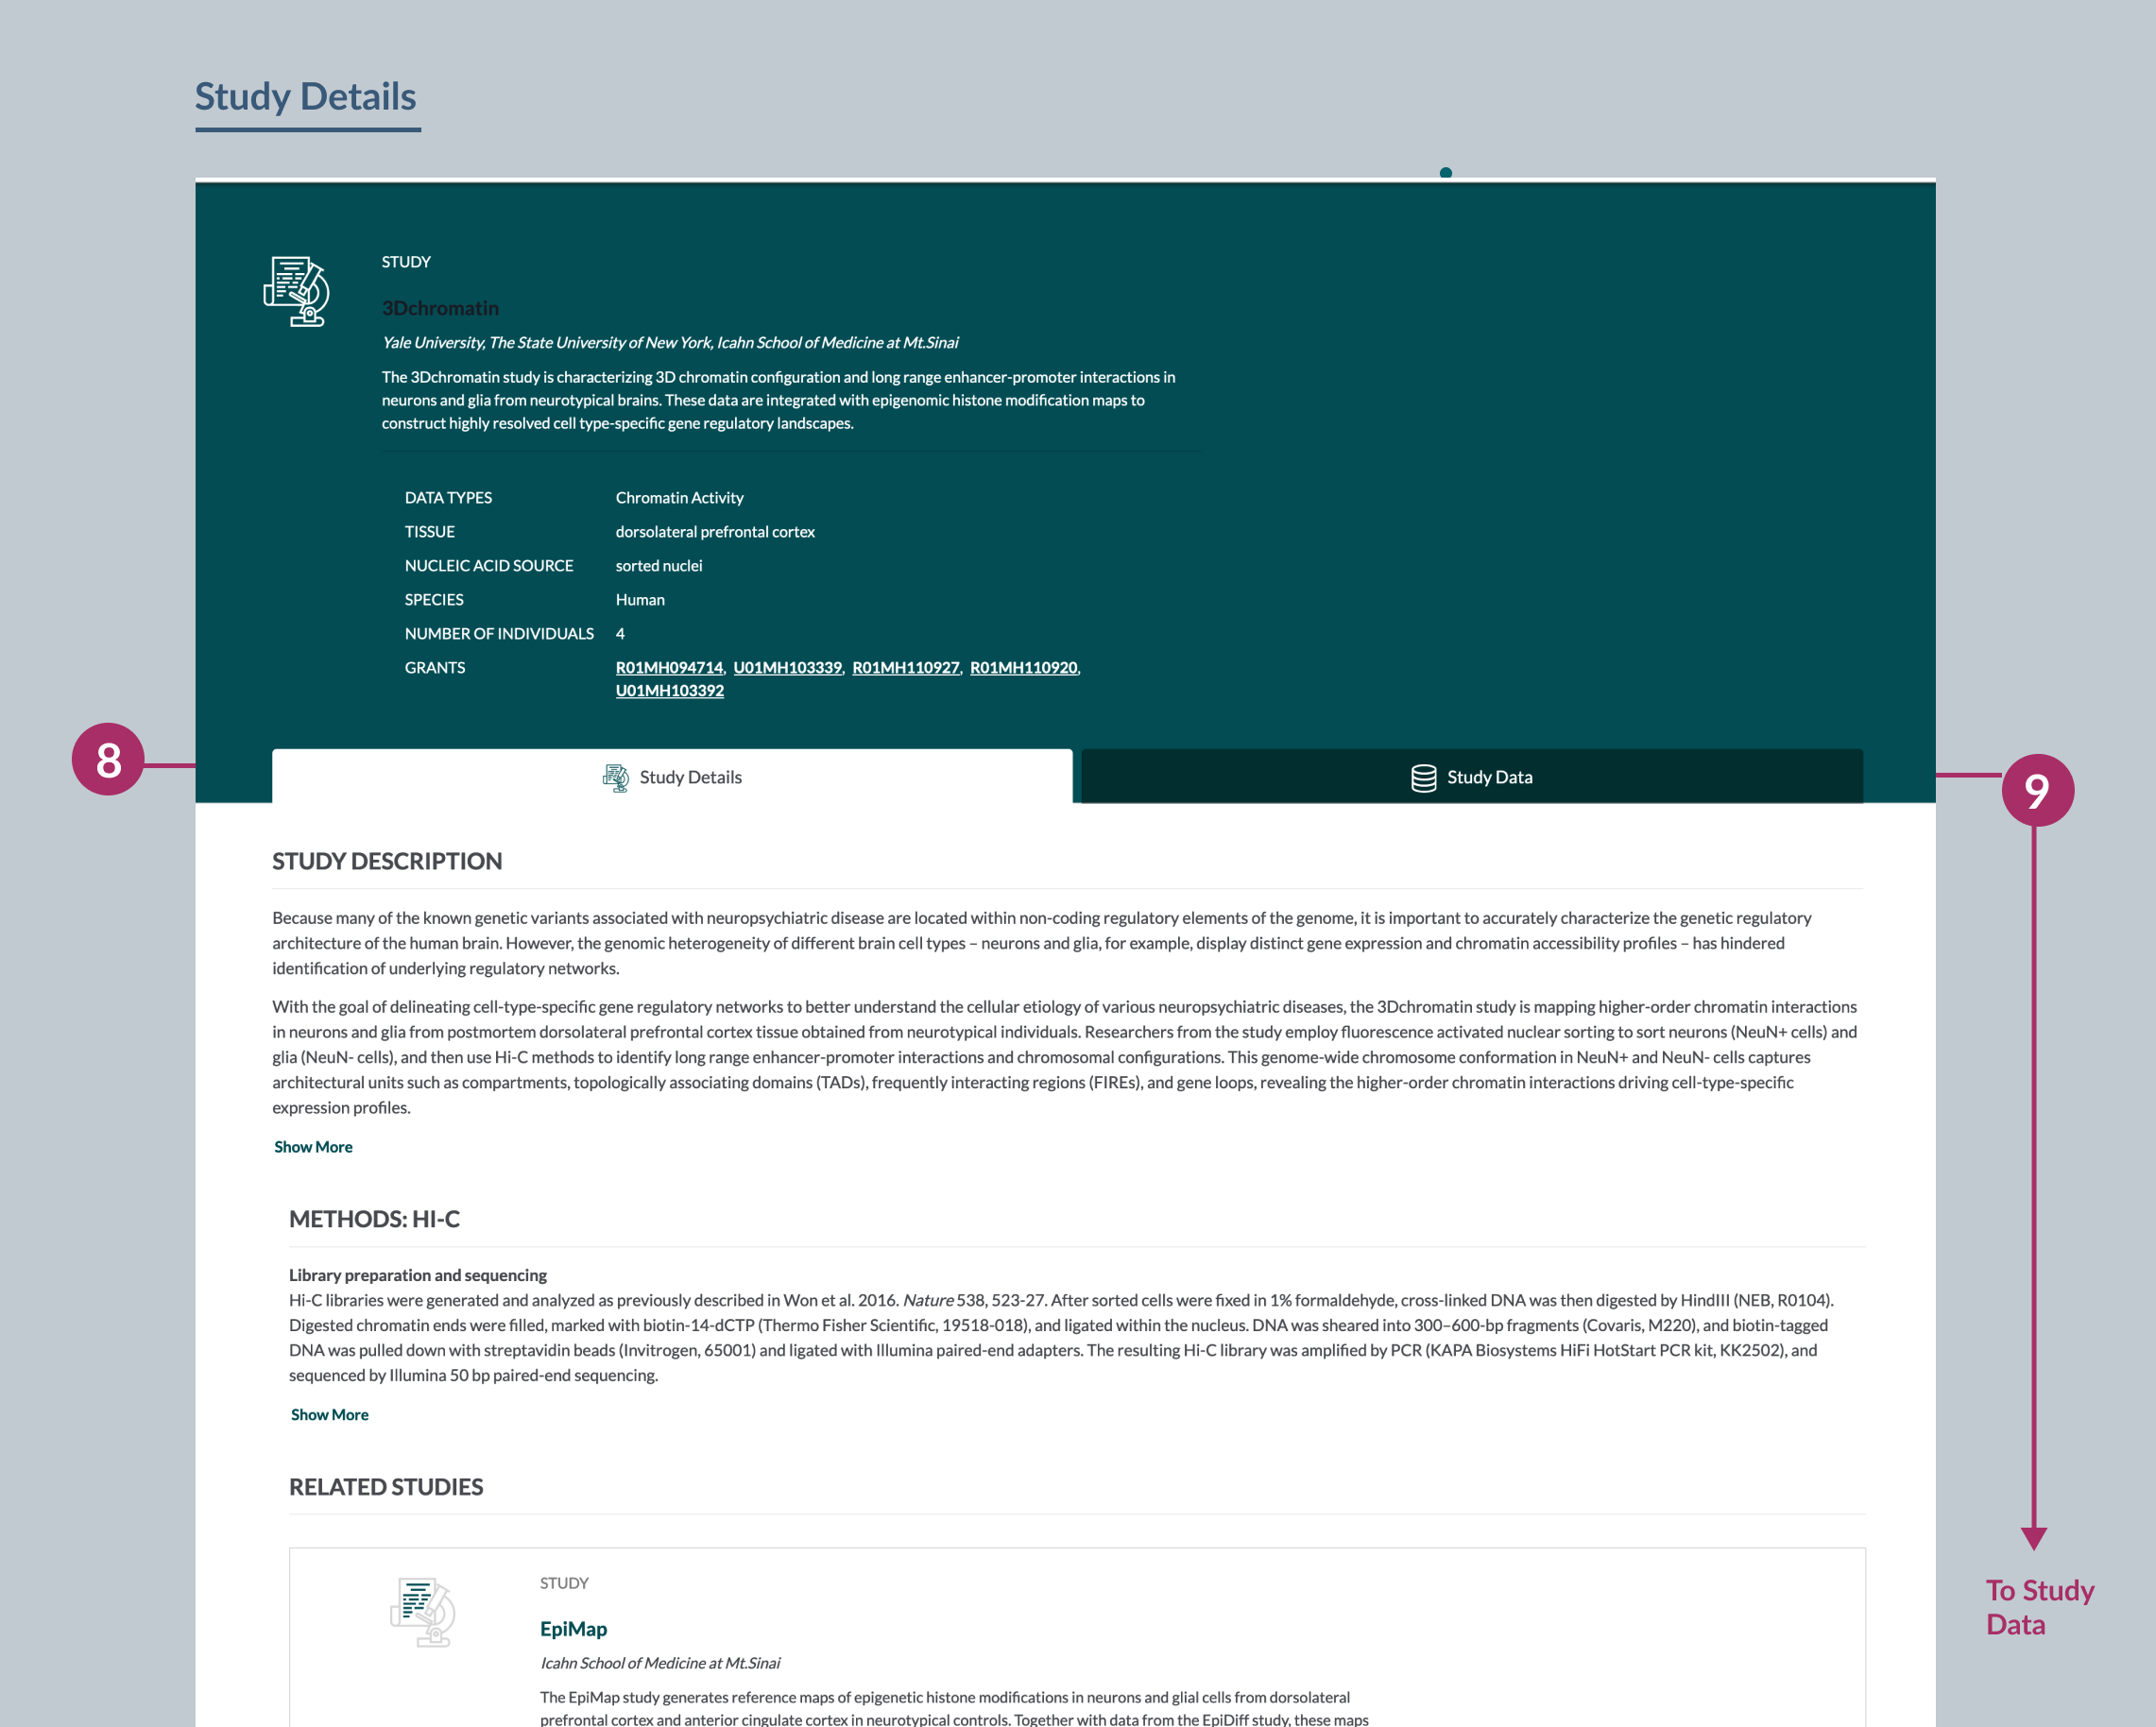
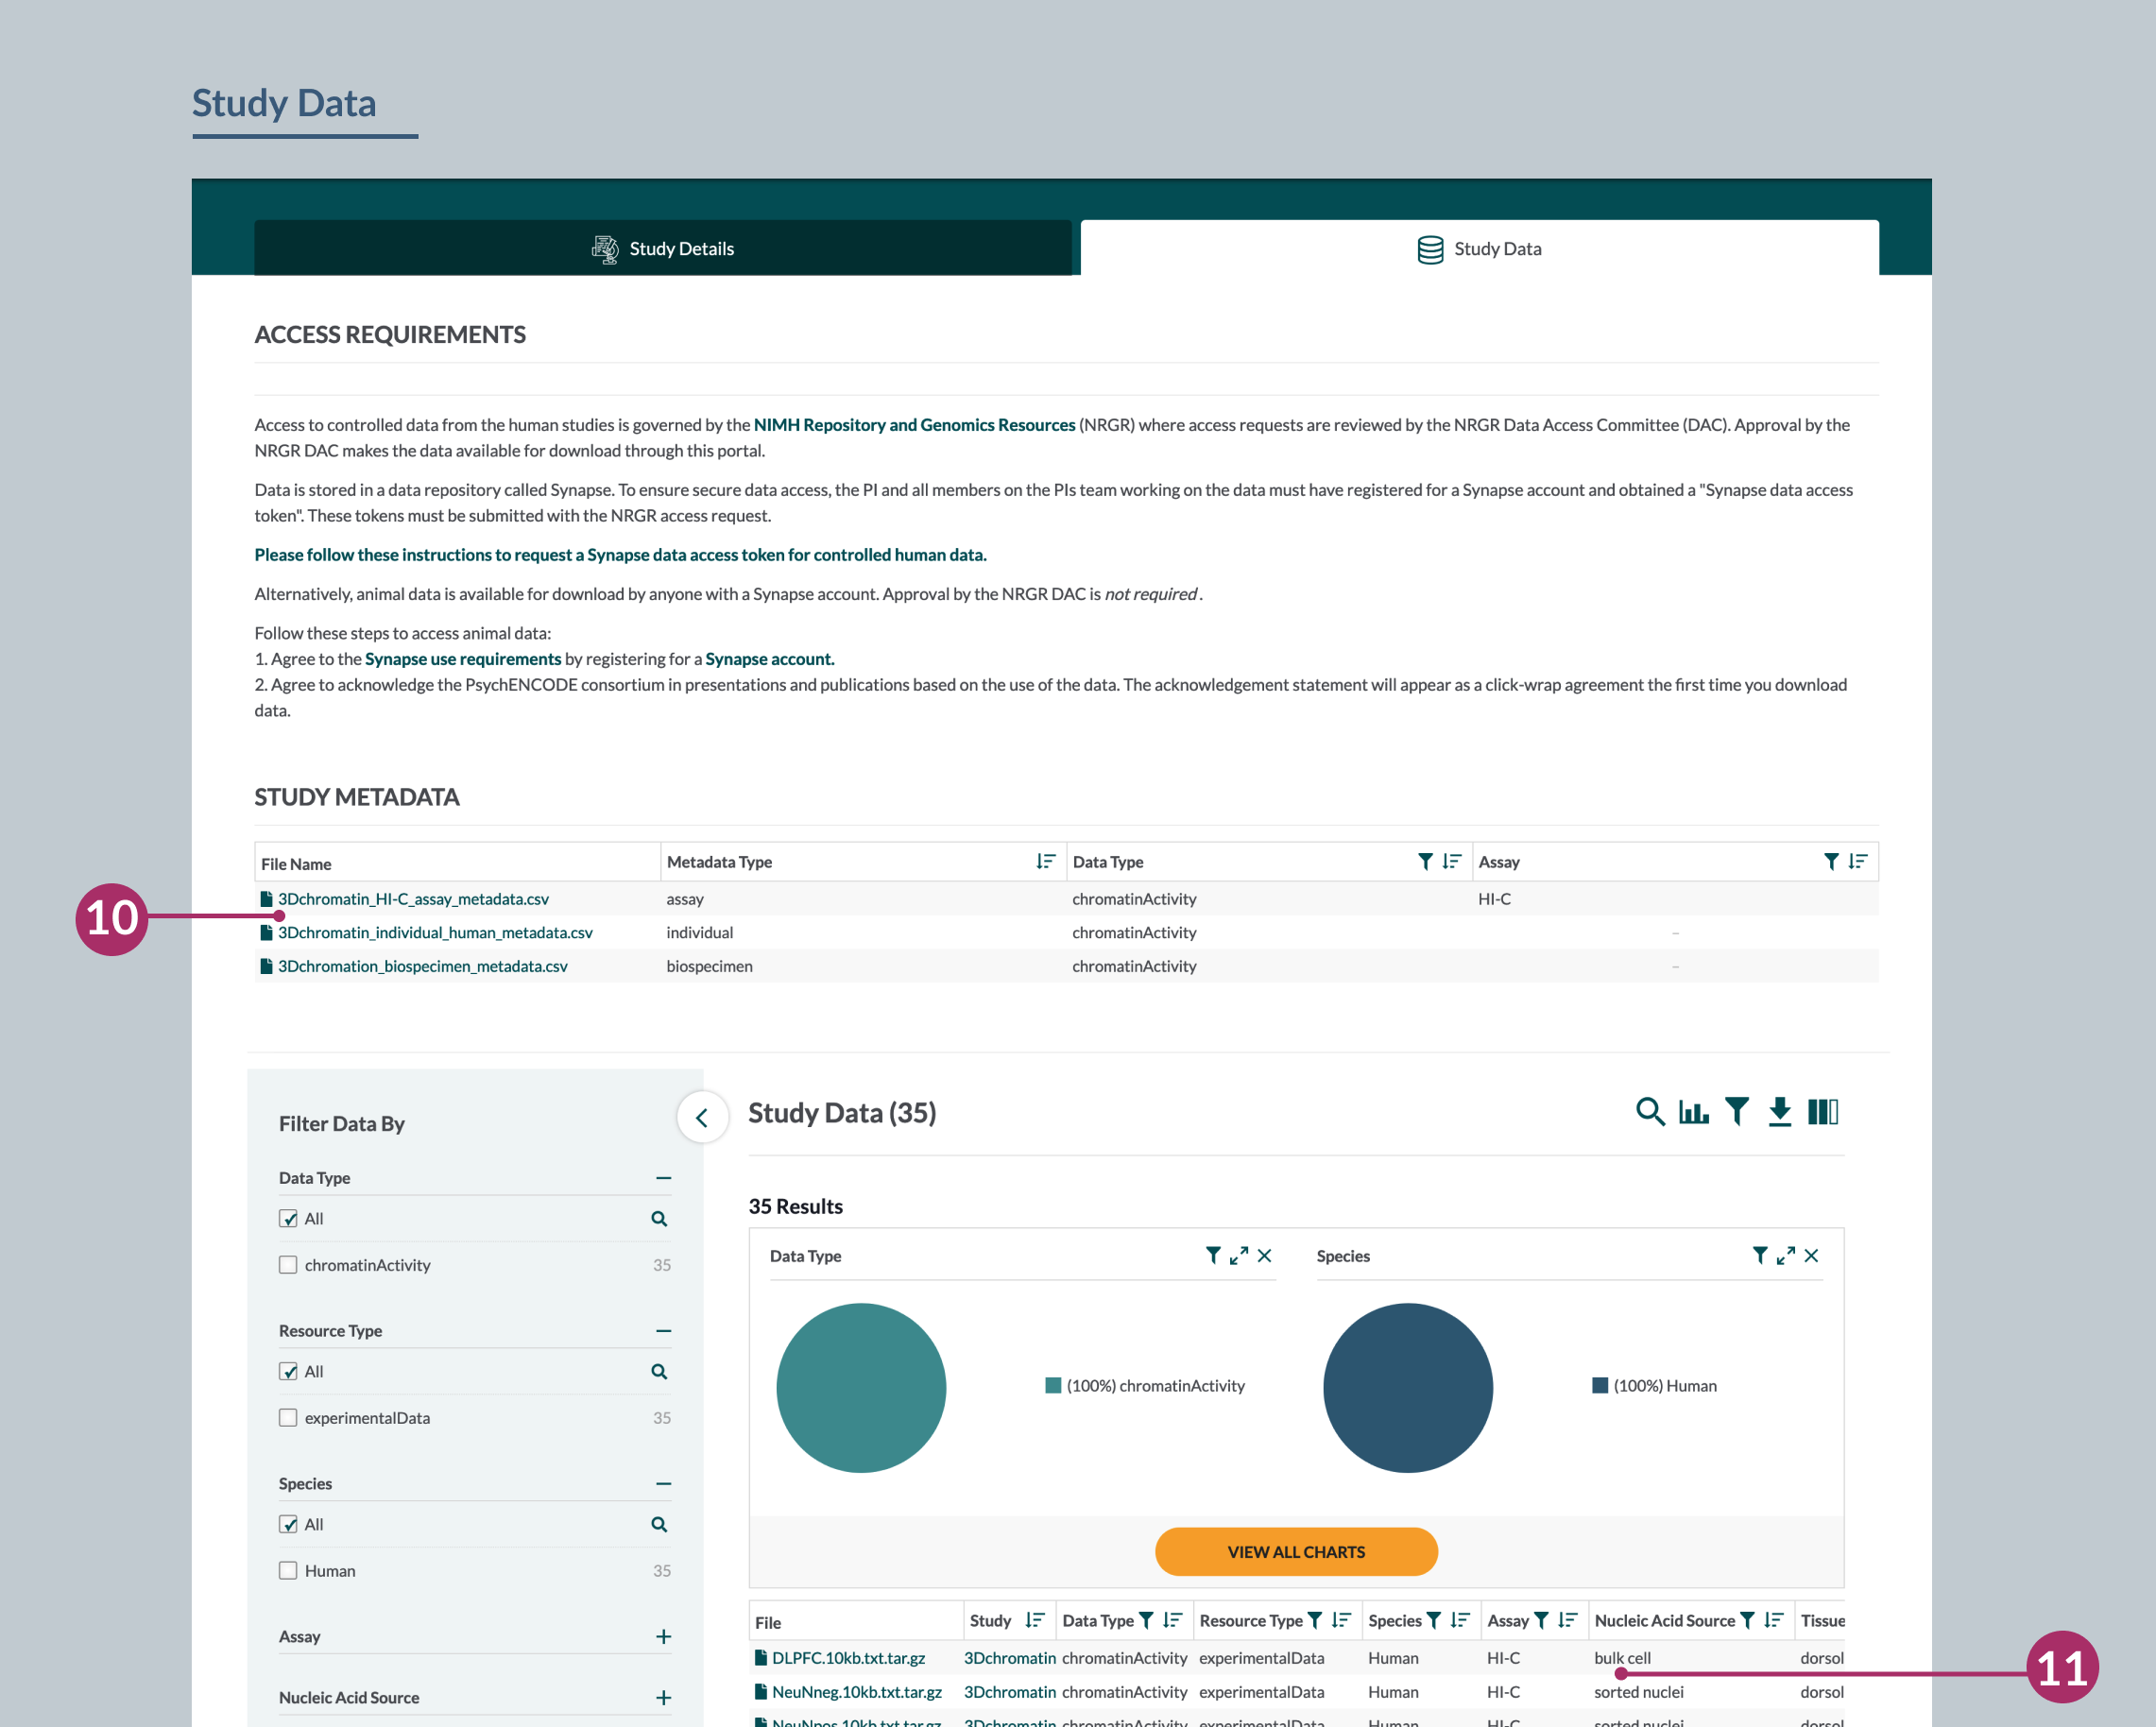
Click on a study card (7) to see the Study Details page which contains more information about the study including the aim, methods, and related studies (8). Clicking on the Study Data tab (9) provides tables containing Metadata (10) and Data (11), allowing you to explore and download these as a set.
Data
This section contains the complete set of files generated by PsychENCODE contributors available for download. We consider “data” to be raw or partially processed information, depending on the type of experiment.
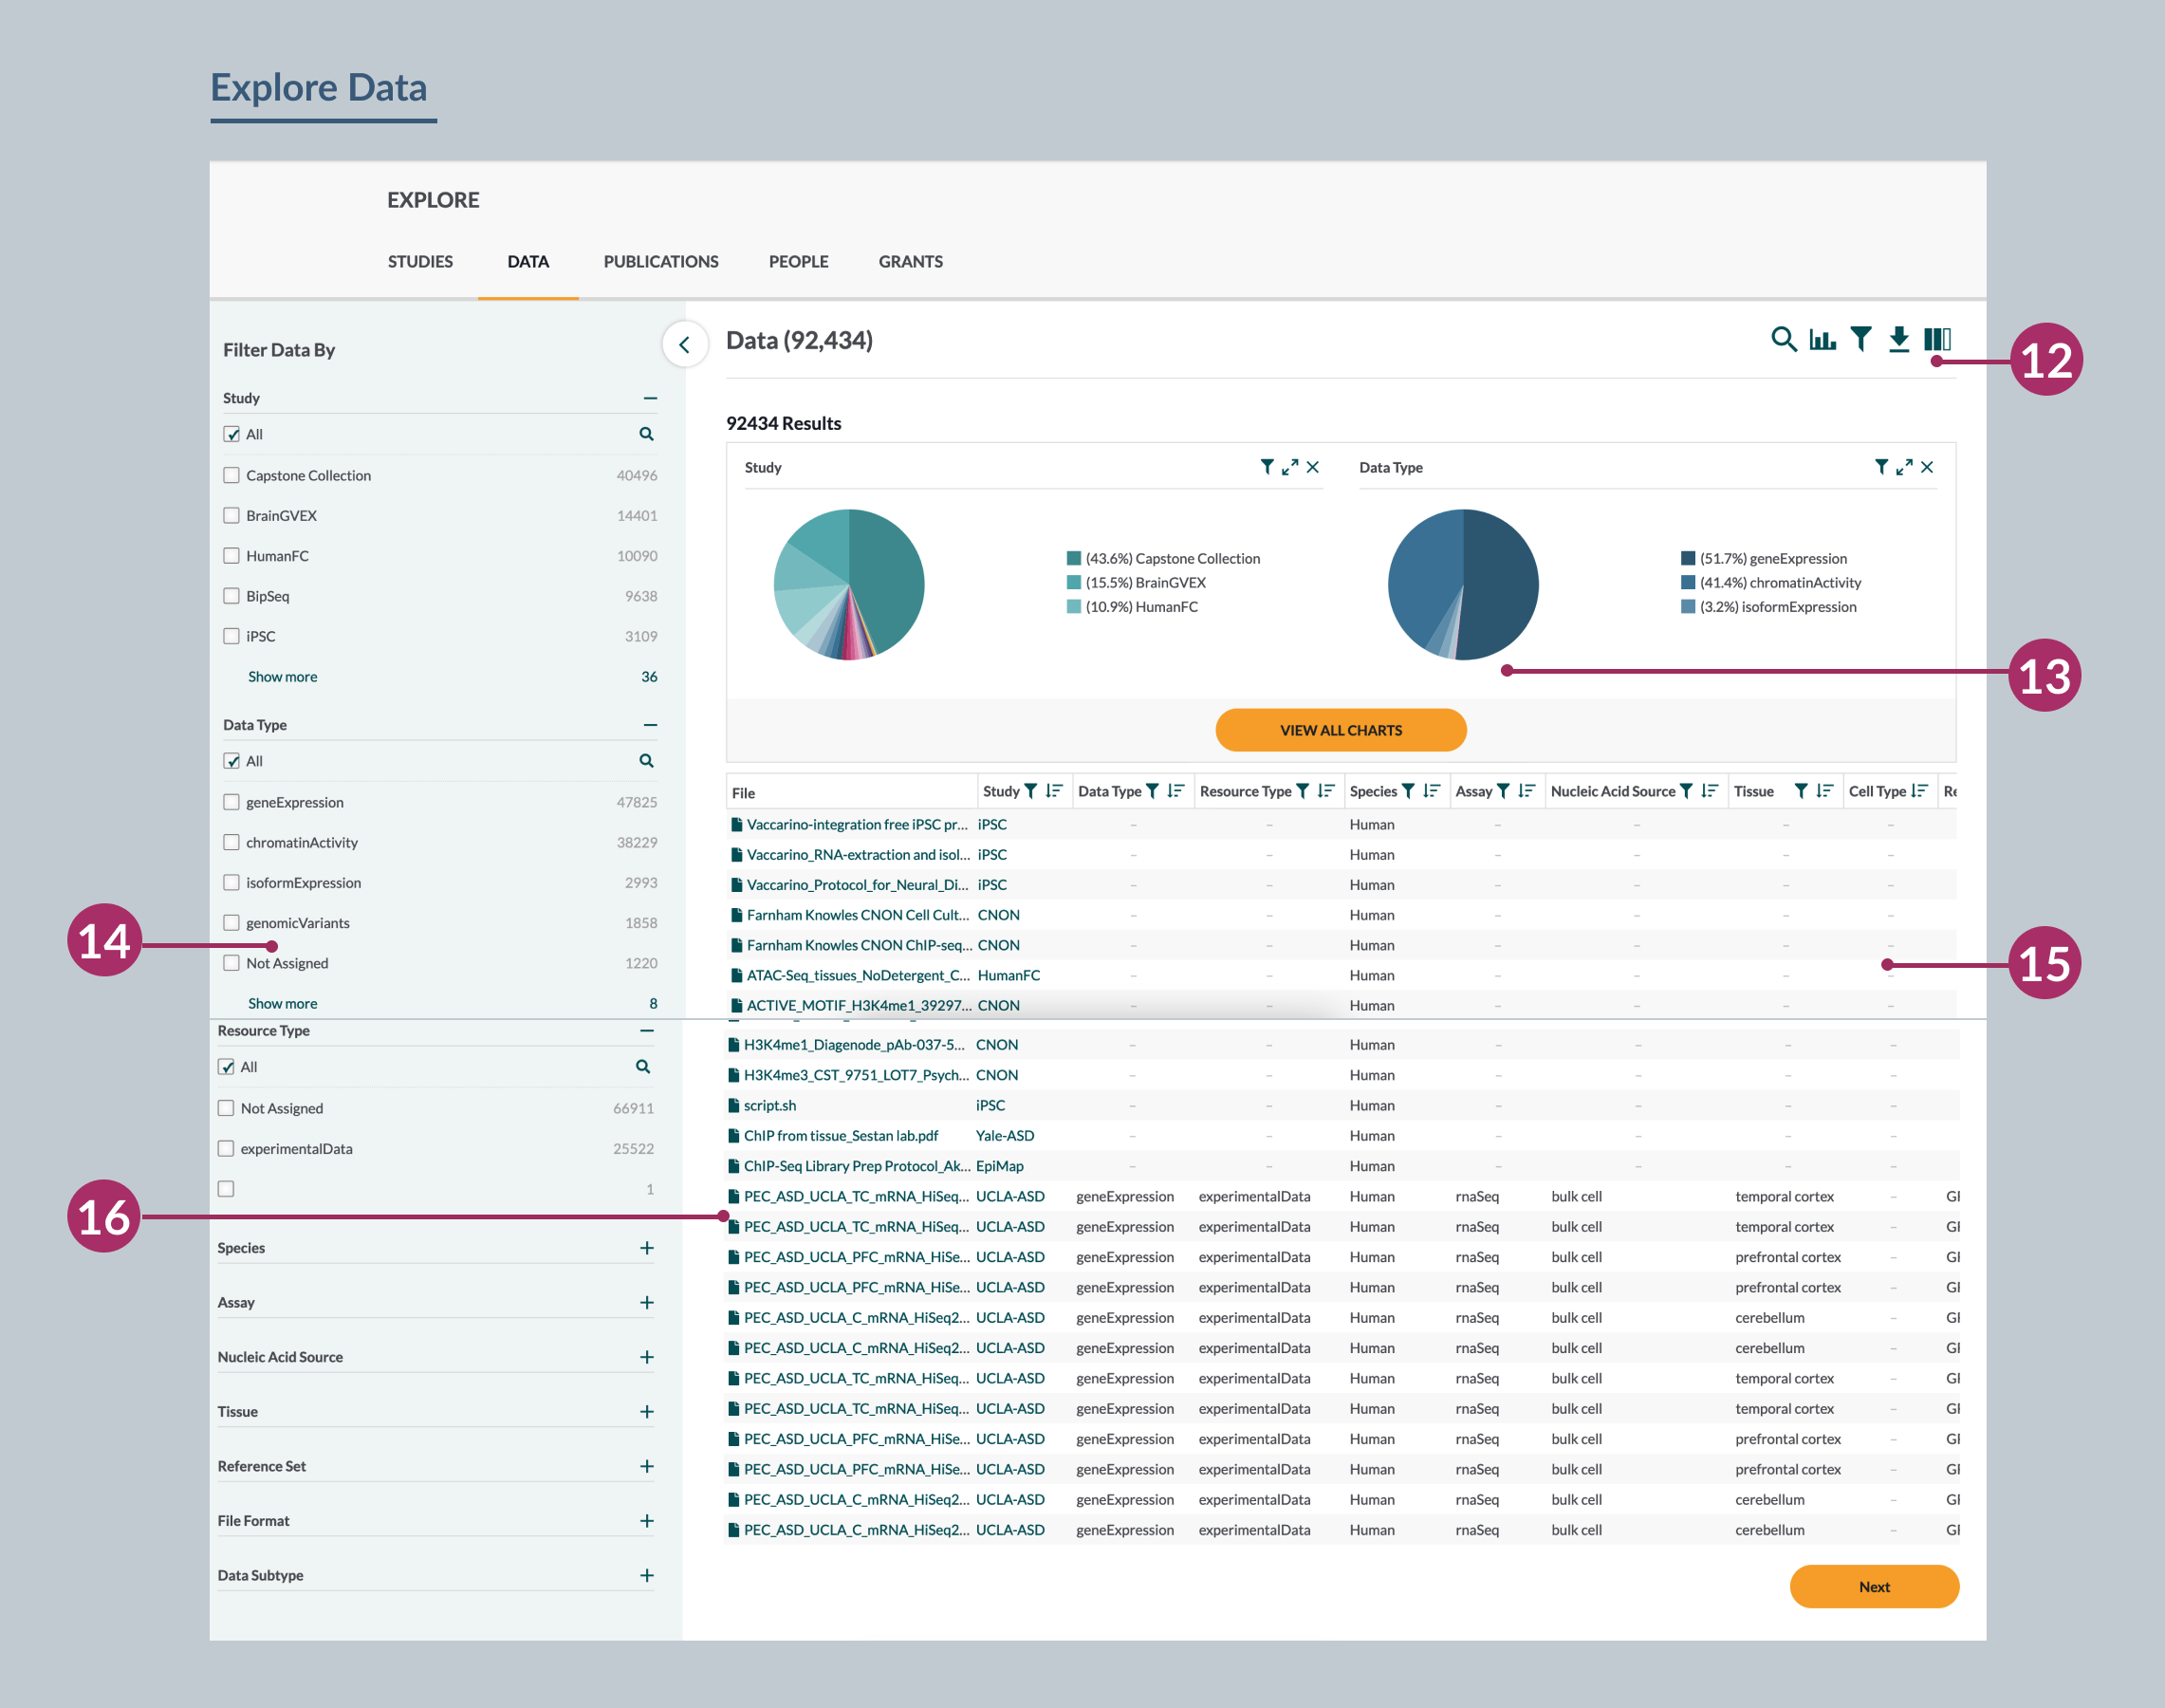
Arriving on this page, you will see options for querying and downloading data on the top right (12). After creating a relevant query with the search bar, visualizations (13) or filters (14) you will see your results reflected in the table (15) and can begin the process of downloading your files. Clicking on a filename (16) will take you to where the file is stored in Synapse.
See Accessing Data to learn more about creating search queries on the portal.
Publications
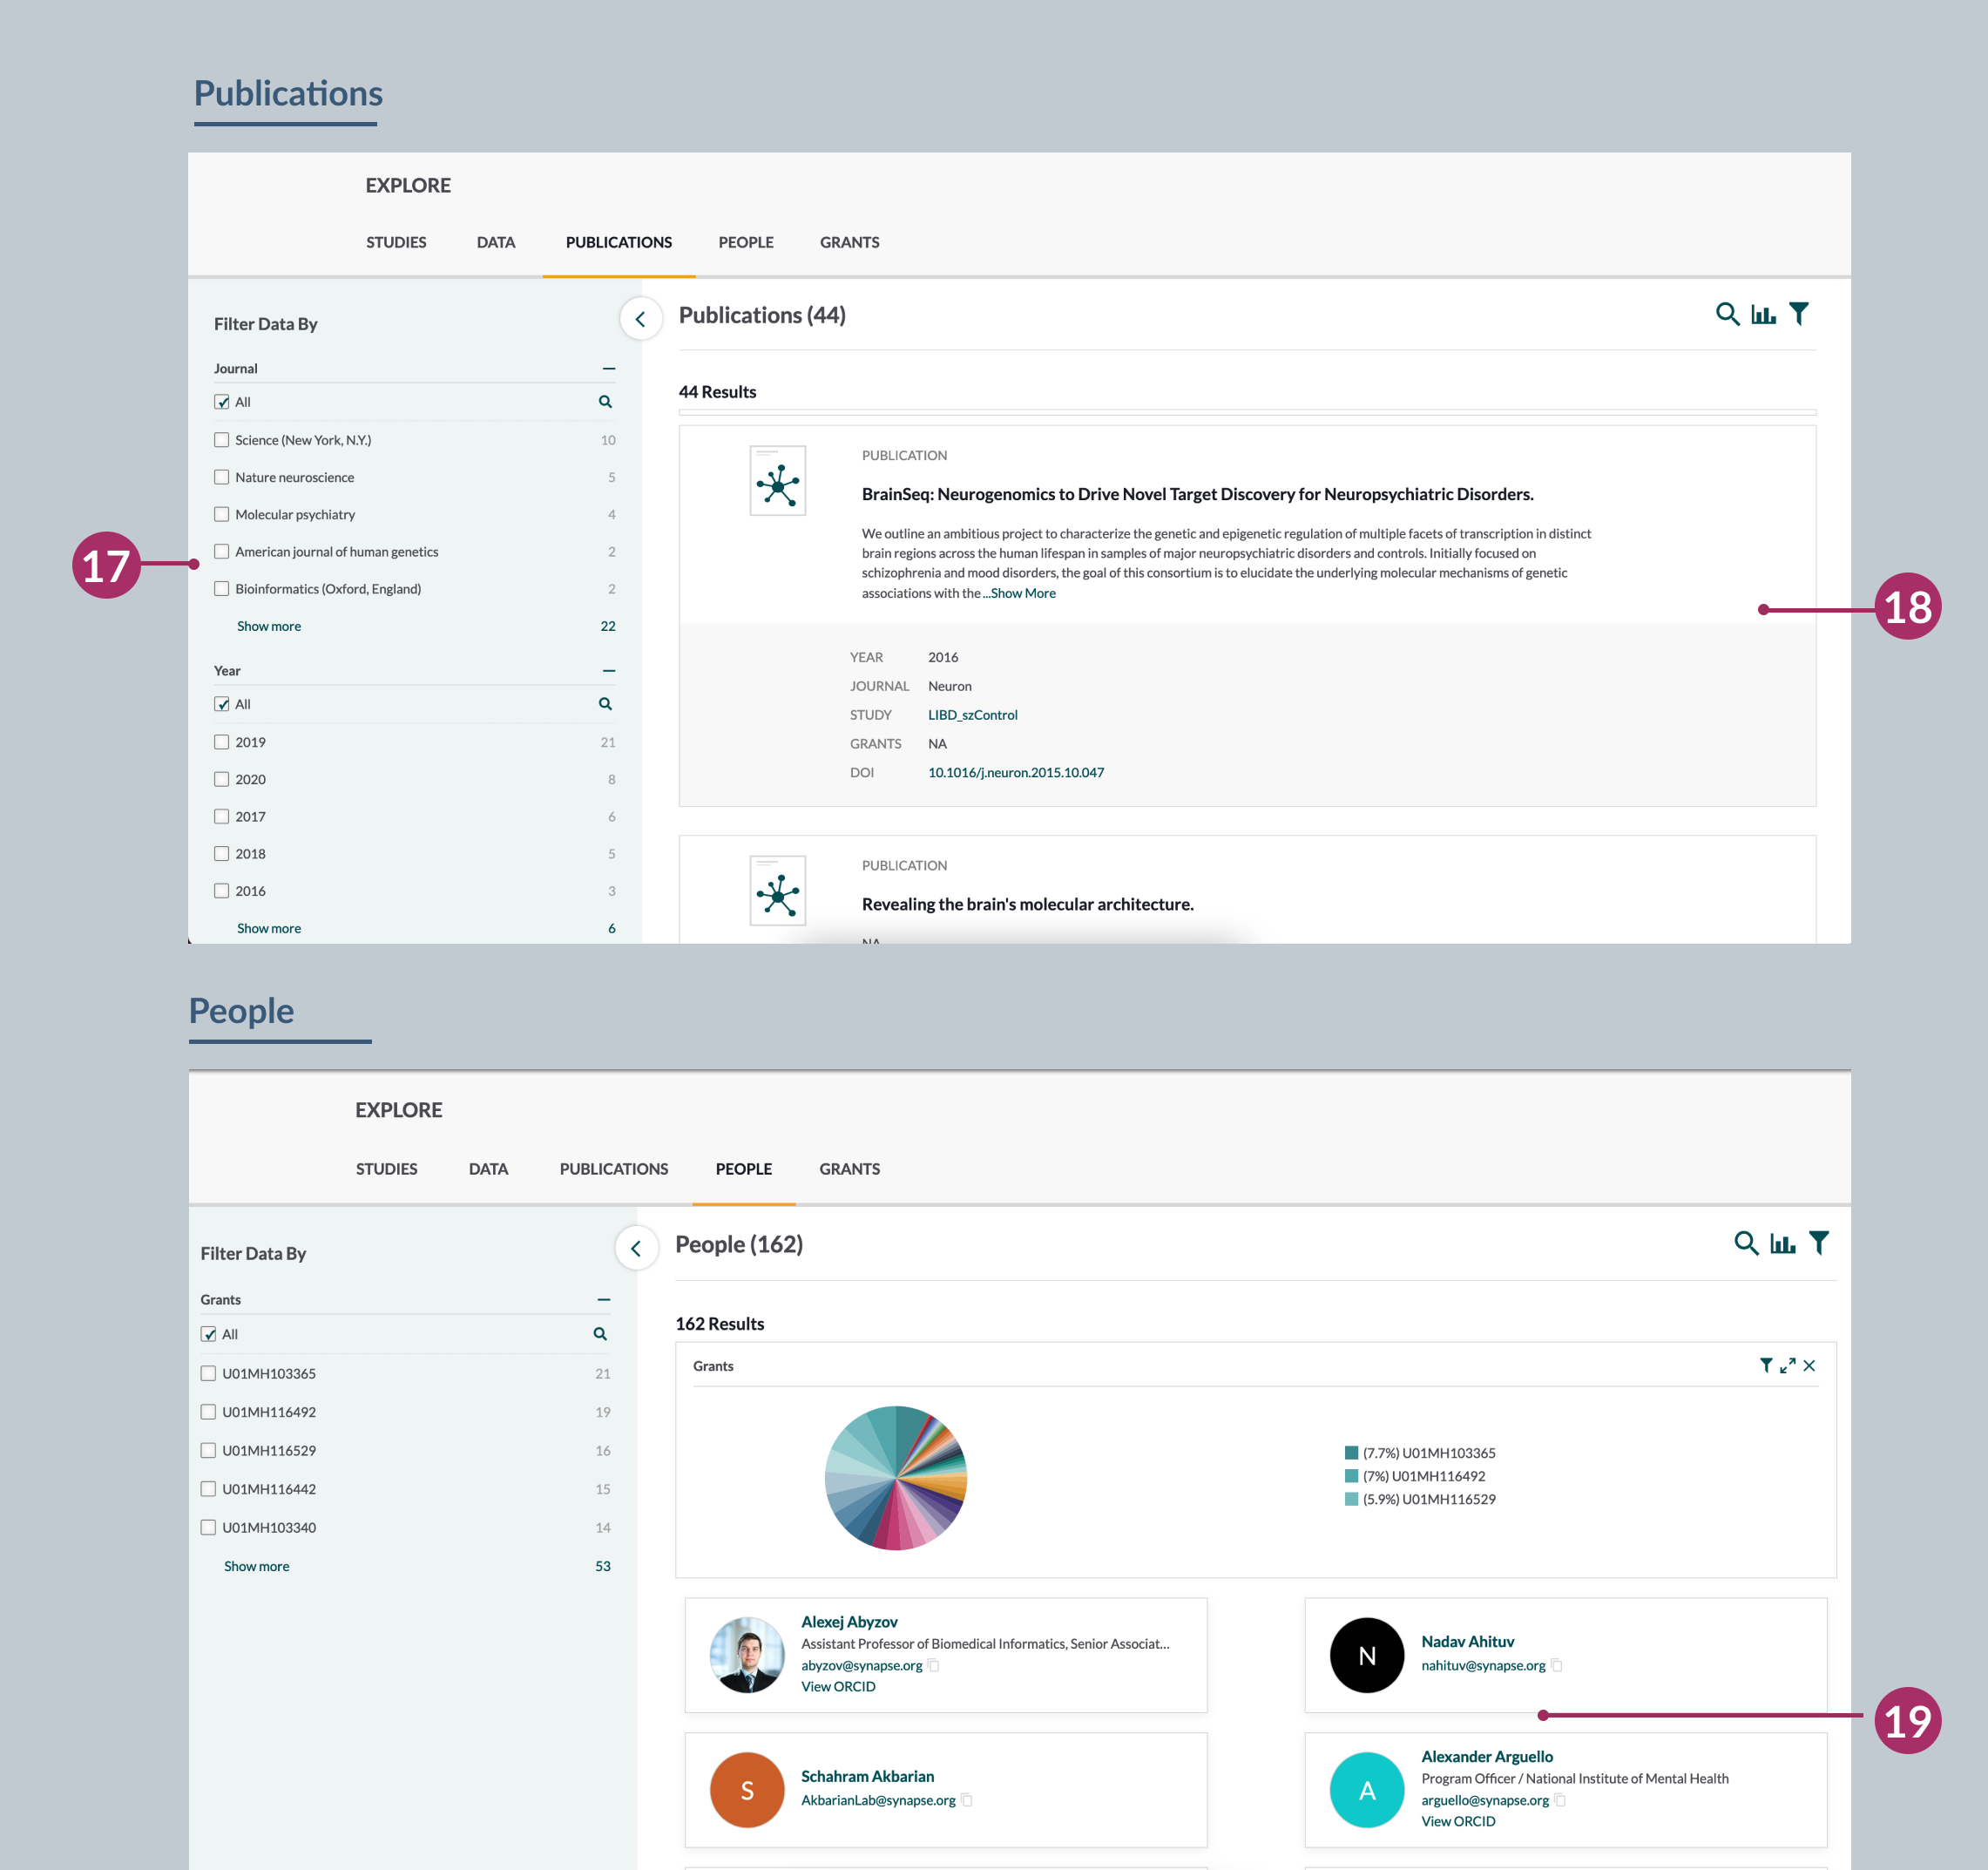
Publications are a core output of data from one or more studies. In the Publications section, you can search for relevant publications by the journal name and publication year using the facets on the left (17) Your search will generate a list of publication cards that describe the various publications and list some core information (18).
Within a publication card, click on “Study” to navigate to the corresponding study card. Within the study card, you can read about relevant experimental details and download data cited in the publication. Click on the digital object identifier (DOI) to access the publication directly. Many of these publications are open access, meaning that they are freely accessible to the public.
People
In the People section, you can learn more about the researchers who contribute to the portal resources and make up the consortium. Clicking on a name (19) will take you to an individual’s Synapse profile, where you can learn more about them. This area of the portal helps to foster new collaborations and provide attribution to researchers within the PsychENCODE consortium.
If you are a registered Synapse user, you can contact anyone on this page using their provided Synapse email address.
See Accessing Data for more details on searching for information in the Portal.